Evaluation of the difference in usage across major social platforms

Introduction:
Abstract:
Facebook, Twitter, Linkedin, Pinterest, Stack Overflow, Snapchat, Weibo, Instagram, TikTok , if this list doesn’t mean anything to you, you have probably been away for the last 10 years. Created for some over 15 years ago, or for others just a few years ago, social networks have changed our lives. Going on instagram liking the latest photo of your friends, reading posts and articles on Linkedin or spending your underground ride watching the latest reddit memes or trendy TikTok is the routine of some people.
We spend hours every day on social networks. If in Switzerland we spend on average almost more than 1 hour per day on social networks, which is already significant, this number remains low compared to other countries such as the Philippines or Brazil, where people spend on average 4 hours and 3 hours 45 minutes per day respectively on social networks.
In our data story, we are going to focus on the use that can be made of social networks, to understand how we consume the different social networks and also to study the possible differences between the networks.
Do we use a work-oriented social network as much and in the same way as a social network focused on the exchange of information or a fun social network? This is what we are going to answer.
Methods
In our data story, we will focus on two major phenomena: the distribution of the number of posts/comments per user and the use of networks according to a circadian rhythm.
The first phenomenon allows us to study user engagement on a platform, how many users post content and in which quantity? In this first part we will also see if power users really exist, power users are users who publish and share a lot of information/posts/comments. It is often thought that a small percentage of users are responsible for most of the content on social networks (20%-80% rule of content generation), we will see if this is true, and if so for all social networks.
The study of the second phenomenon will allow us to see if our use of social networks is linked to a certain rhythm. Are we going to use social networks on a certain day, at a certain time? We will also see if the observations are common to all networks or if each social network has its own specificities.
Social networks studied
In our data story, we will use data from 4 social networks: Twitter, Stack Overflow, Weibo and Reddit. We will present these social networks and then we will look in more detail at the datasets we were able to use for each social network.

Stack Overflow
Stack Overflow is a social network founded in 2008 of questions and answers on a wide range of topics concerning computer programming. The site is very popular in the student and programmer community. Today, the site has more than 11 million registered users.

Are you power users?
Data in numbers
| Social Network | Data |
|---|---|
| 15 millions of tweets from 34k users | |
| Stack Overflow | 76 millions of comments from 13 millions of users |
| 4,8 millions of posts from 1,1 millions of users | |
| 6,3 millions of comments from 150k users |
Distribution of the number of posts according to users and platforms
Now let’s take a look at how the users of these different social networks use them. Did they really use it as a social interaction tool as it is suggested by the name? Or do people use it more as a “fast food” content consumption service? In order to have a better idea of this, we can look at the distribution of the number of posts by user.
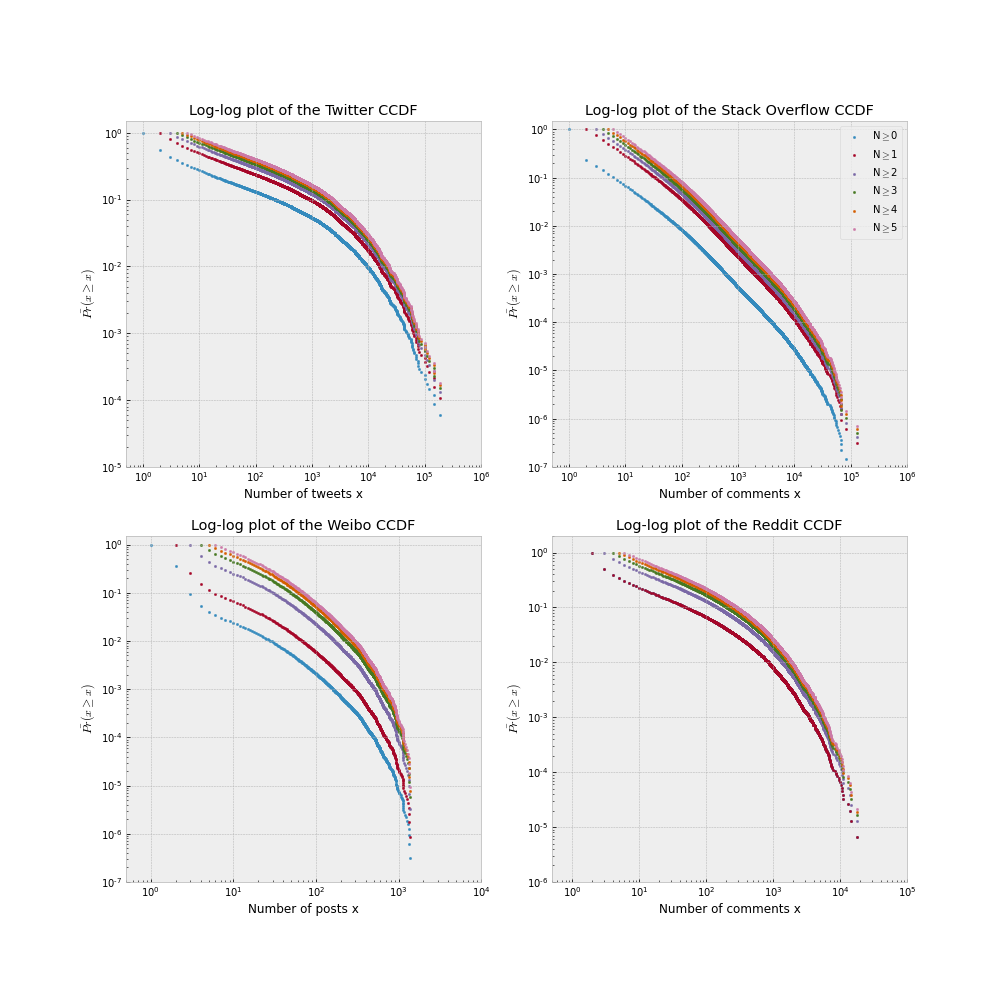
In these graphs we recognize that the distribution of the number of posts/comments per user is a power law. This observation is particularly true for the Stack Overflow data. On Stack Overflow we have a very representative set of data since we have all the data of the site since its creation, and we notice that we can approximate the distribution by a straight line in log-log scale, a characteristic sign of power laws.
As we can see, in most social networks, about half of the people didn’t share any content and the big majority of them only post a small amount of the content. You probably recognize yourself in this remark, many of us use some social networks in a passive way. Using Stack Overflow just by looking at the answers to other questions, on twitter browse your feed without posting or look at the best reddit memes without posting any.
Most of the content is generated by a minority of users. If we take the case of Twitter, 2% of users created 76% of tweets, and 14.5% of them created 99% of posts. We also found close results for Stack Overflow, with 2% of users sharing 76% of the results and 18% of the created 99% of the posts. Now let’s take a closer look at how this distribution behaves for Weibo. This distribution was created from a one-week time span. We can see that less than a tenth of the users post content each week. In Weibo 2% of the users created 82% of the content, and 8% of the user created more than 99% of the post. This further emphasizes the idea that the majority of content is created by a minority.
On the other hand, if we look amongst the active users (the users who have shared at least one post), we see that Weibo seems to be the most participative social networks with 96% of users creating 99% of the content. One the second place we found Stack Overflow with 78% users creating 99% othe content. For Reddit 60% of the users create 99% of the content and finally for Twitter, only 26% of the active users create 99% of the content.
Most of the social networks are mostly composed of a large invisible mass that is only there to consume the content and does not really create significant social interaction. But if we look amongst the active users, the results seem a bit more mixed and more users seem to be involved in the creation of content. There is a great disparity between the different social networks. It should also not be forgotten that in all these networks, there are other kinds of social interactions, as “likes” or “upvotes”, but these are not as strong social interactions as comments and these interactions don’t create any content.
User Behaviour
Data in numbers
| Social Network | Data |
|---|---|
| 3 millions of tweets from 4k users | |
| Stack Overflow | 1 million of comments from 22k of users |
| 40k posts from 431 users | |
| 272k comments from french subreddit |
Usage trends
Waking up and checking your Facebook messages, scrolling along your Twitter feed while you’re making your morning coffee, watching 1 or 2 Youtube videos during your afternoon break and laying back at the end of a long day to check the latest memes on /r/pcmasterrace. Nowadays, almost everyone has an online presence and a daily routine to go along with it.
But can we expect those habits to be similar amongst the user base of a social network ? And are there usage trends across all of these platforms ? This is what we’ll try to find out.
To do so, let’s observe some elements that characterize the trends in behaviours of users for our four platforms and focus on two metrics: the number of posts and the number of active users at different times of day and for each day of the week.
Comparison between the distribution of posts during the day across our platforms
Based on the graphs, some observations can be made:
- Usage drops across all platforms at night, and increases in the morning.
- While for Twitter and Weibo, usage continues to increase during the day and lowers at night, starting at around 9pm, the trend seems to differ for Reddit and Stack Overflow. For these platforms, the activity drops earlier, at around 2pm for Reddit and 3pm for Stack Overflow.
- Stack Overflow is a work-oriented platform, these observations are in line with the usage we expect. The users are mainly active during work hours (9pm-5am). We can even see little drops at lunch time.
- The same remark as the previous one can be made about Reddit even if it can be surprising considering that it is a social network that contains all kinds of contents.
Social network through the day
When we look at the peak usage of our networks, we see that peak of user activity is quite different across our 4 websites:
- The number of comments on our Reddit data reaches its peak at around 10am.
- Stack Overflow number of comments and active users are relatively stable across the workday (9am-4pm) but there are significant peaks around 10am and 3pm.
- The number of posts on Weibo climbs all day long and peaks at around 10pm.
- The number of posts on Twitter climbs in the morning, stabilizes between 12am-2pm then continues to grow until 8pm.
This shows us that depending on the time of day, we will not consult the same social network. Our use obeys a certain rhythm, which is essential and may have certain consequences such as for the diffusion of information. News published at a peak time will reach more people and have a greater impact.
We can summarize the distribution of the activity in the following table:
| 00-06am | 06-12am | 12am-06pm | 06-12pm | |
|---|---|---|---|---|
| 15.2% | 19.2% | 28.3% | 37.3% | |
| Stack Overflow | 7.5% | 29.7% | 40.7% | 22.1% |
| 9.3% | 23.1% | 32.2% | 35.4% | |
| 6.7% | 28.9% | 39.5% | 24.9% |
And on the user side ?
After having studied the activity related to the posts and comments, let’s dive into the users’ activity.
Comparison between the distribution of active users during the day across our platforms
The distribution of active users by time of day and day of the week does not differ dramatically to the posts. We can still note a few interesting observations. For Twitter the number of active users does not increase as fast as the number of tweets during the day. It seems that people tend to tweet more at the end of the day. For Stack OverFlow, the peaks in number of comments correspond to the peak in active users. Finally for Weibo, trends are very similar across both of the distributions.
Weekday vs Weekend : let’s fight !
Moreover, we can observe how those trends vary across the week. On Twitter, we see that usage tends to stay similar from sunday to thursday. On fridays and saturdays, we can observe a decrease in usage. In fact, while there is only about 2% more usage during the week than on weekends, there are 6% more posts between Sundays and Thursdays than there are on Fridays and Saturdays.
On Weibo, the difference is not very significant as well. We could observe a 3% increase in usage on the weekdays compared to weekends.
On Reddit and Stack Overflow on the other hand, those gaps are much more pronounced. Reddit users are commenting 90% more during the week than on weekends, and people comment more than twice as much during weekdays on Stack Overflow.
These last two observations could be explained by the nature of the websites. For example Stack Overflow being oriented on code, it can be tempting for users to disconnect on the weekends, just as they would from work. Only students use it during weekends :)
Extra : When to ask a question on Stack Overflow?
Stack Overflow : a true friend
We all regularly use Stack Overflow, when we have a question about a dark java bug, to learn more about certain libraries, or to find out how to better use pandas for our ADA assignment. Have you ever wondered what was the best time to get a quick answer to your question? We have asked ourselves that question.
As we have seen previously depending on the time and the day, the activity on the social networks is not the same. On some social networks activity is high in the morning and then drops off in the evening, while other social networks have a different usage pattern.
We have seen before the rhythm of use of Stack Overflow, being used mainly for work, the rhythm of use is indexed to working hours, users are mostly active during working hours, i.e. generally between 8am and 6pm. Let’s now see if this coincides with the hours when the percentage of quick responses is highest.
Use it at night !
If we have one piece of advice to give you, it is to ask your questions at night, given that the highest percentages of answers in less than an hour are between 20 p.m. and midnight. This may seem counter-intuitive, as we have seen that this is precisely the time when the number of comments and active users are lowest. Thus we notice that more active users does not mean that you will get a response faster, it is even the opposite that happens.
Nevertheless, no matter what time of day or day of the week you have a good chance of getting a response on Stack Overflow.
Conclusion
To conclude, we were able to see that in terms of the use of social networks, there are points of similarity as well as major differences. Thus if in most social networks we could see that they were mainly based on the activity of a restricted group of users - the power users -, we could also see that the rhythm of use of the networks could be very different. Even if this last point may seem obvious, we can see that the dynamics of use are very strong and this can be an element to help us keep control over social networks or for companies in their commercial activity.
Concerning our analysis, It should be noted that some of our analyses are limited due to our datasets. For example Both Reddit datasets don’t contain users with 0 posts. The information related to the dataset used is available in the repo of our project and we invite you to have a look at it if you want any further information.
A last word about social networks: Use them, but use them wisely.